Trends from the Largest, Real-Time Fundraising Benchmark Featuring 1,000+ Nonprofits
Most nonprofit fundraising benchmarks read like a history lesson.
By the time you get to see the data, it’s already 6 months out of date.
To make matters worse, even many of the most respected nonprofit fundraising benchmarks are based on survey data—not actual performance pulled straight from the source.
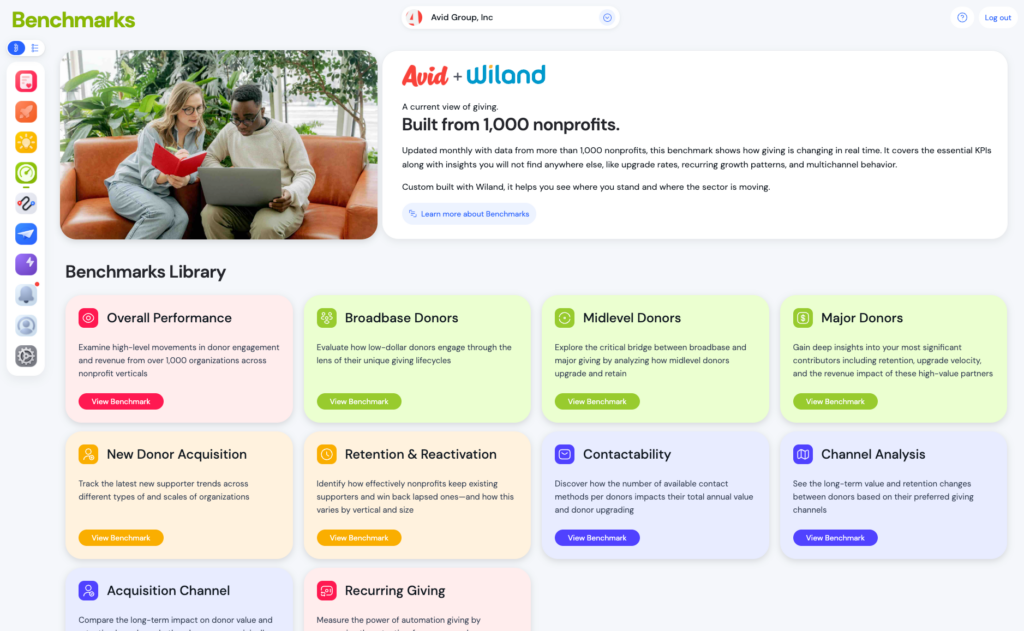
The Avid+Wiland fundraising benchmarks are built differently.
Real data. Not surveys.
1,000+ Nonprofits. $14B in Annual Revenue.
Filterable to your peers. Not generic insights.
Today, we’re going to look at the latest trends, challenges, and opportunities as of March 2026.
To view the most up to date nonprofit fundraising benchmarks, activate free access to the Avid + Wiland benchmarks here »
Nonprofit Fundraising Snapshot
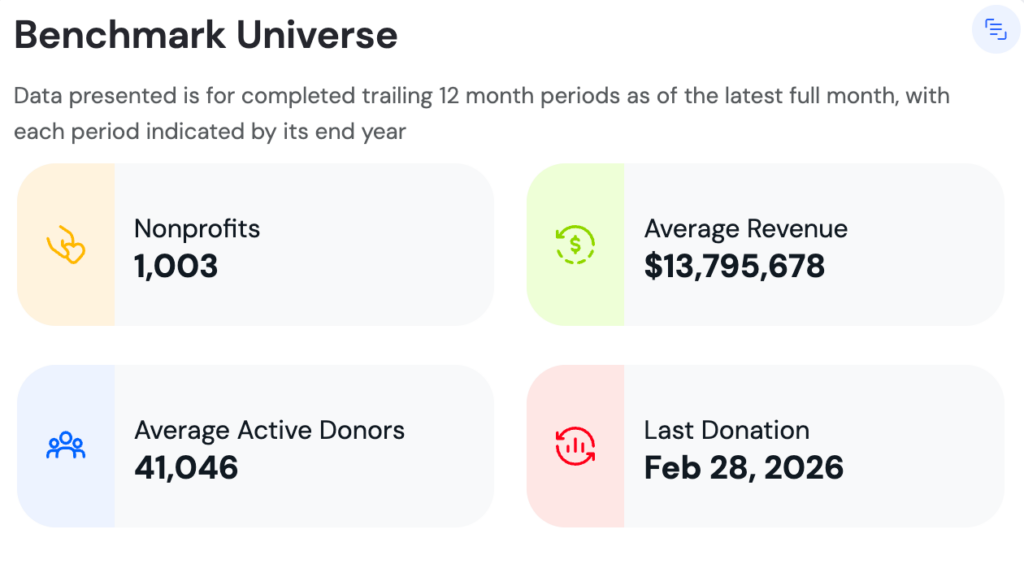
The nonprofit fundraising benchmark snapshots below represent trends from the past 12 months—March 1, 2025 through February 28, 2026.
The snapshot you see below represents 1,003 nonprofits averaging $13.7M in annual donation revenue.
Nonprofit Donation Revenue
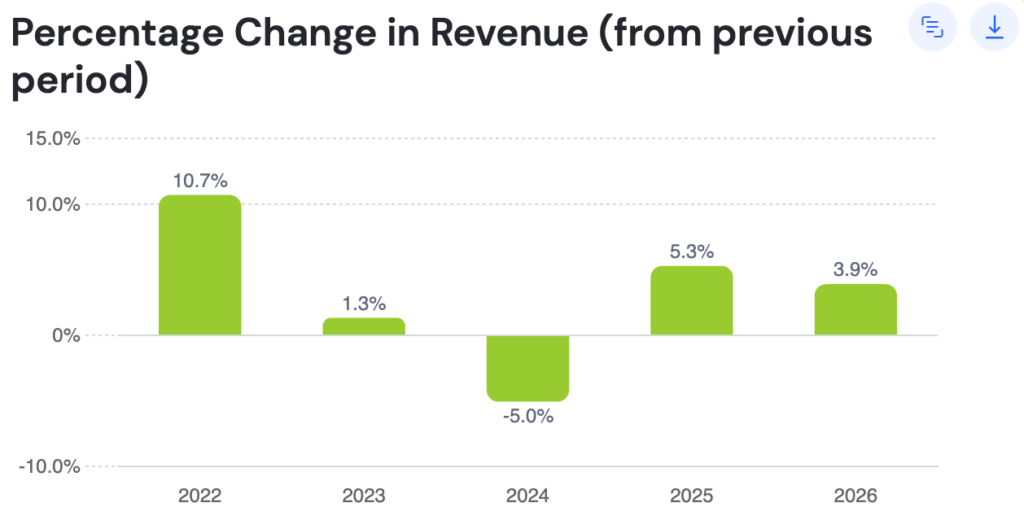
Nonprofit donation revenue is up 3.9% over the past 12 months.
- Average Gift Size: $113
- Average Annual Revenue Per Donor: $362
Number of Donors
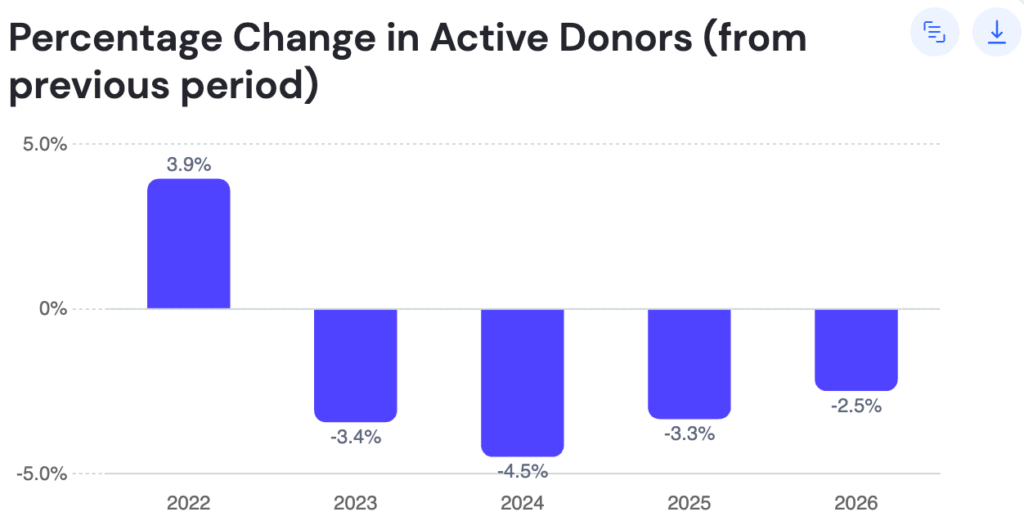
The number of total active donors is down by 2.5% over the past 12 months.
Acquisition Rates
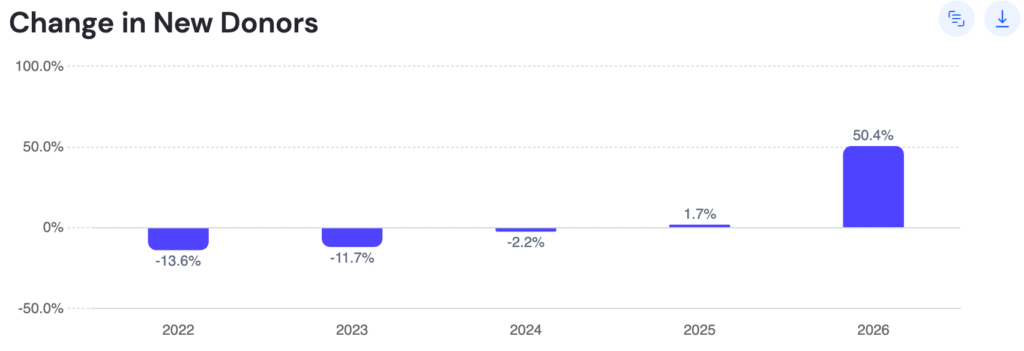
New donor acquisition rates are up by 50.4%over the past 12 months.
Special Note: Acquisition rates are being heavily skewed by 2 specific cause areas. See how organizations in your vertical and revenue size are performing by activating your free access to the Avid + Wiland benchmarks »
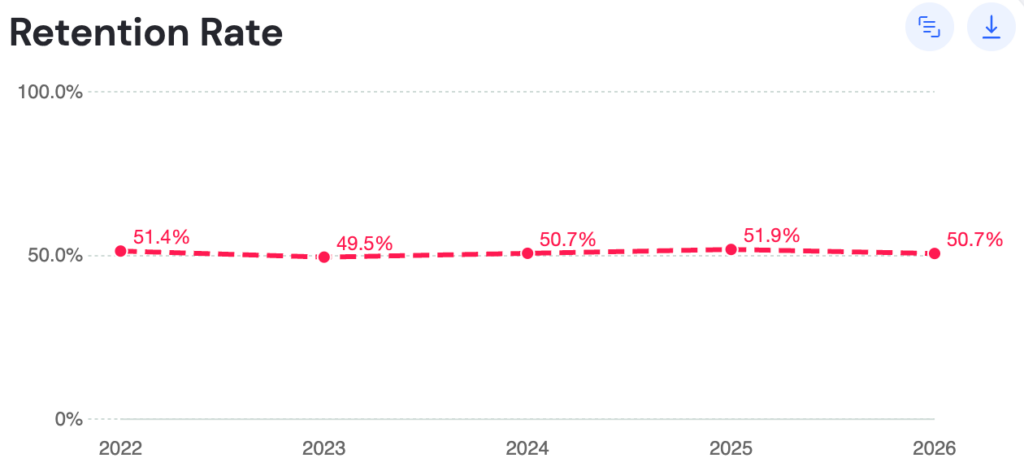
Retention Rates
Retention has seen a slight decline, sitting at 50.7%. That is down 2.3% from 12 months ago.
- Mid-level donor retention rate: 66.9%
- Major donor retention rate: 71.7%
Reactivation Rates
Reactivation rates continue to fall dramatically, sitting at 4.6% overall. This is down 11.5% from 12 months ago.
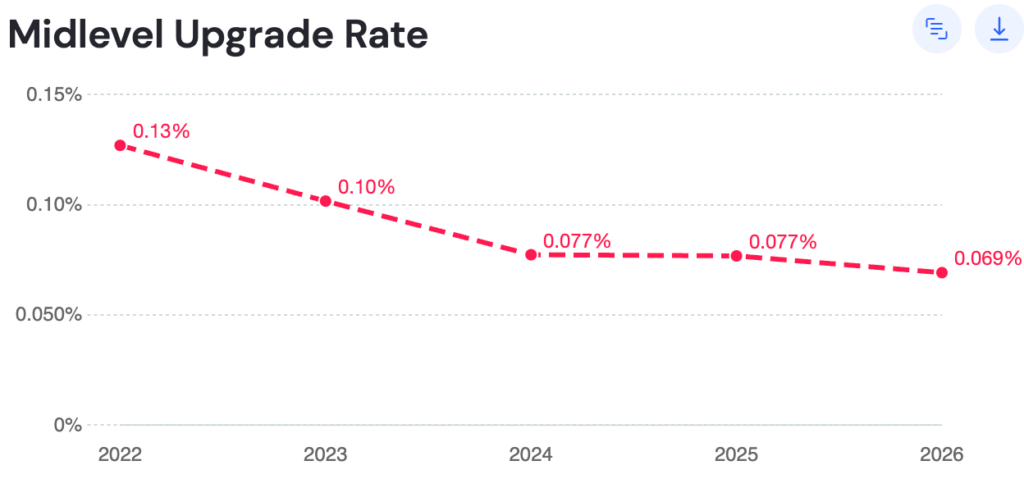
Upgrade Rates
Mid-level donor upgrade rates are at 0.069%, a 10.3% decline from 12 months ago.
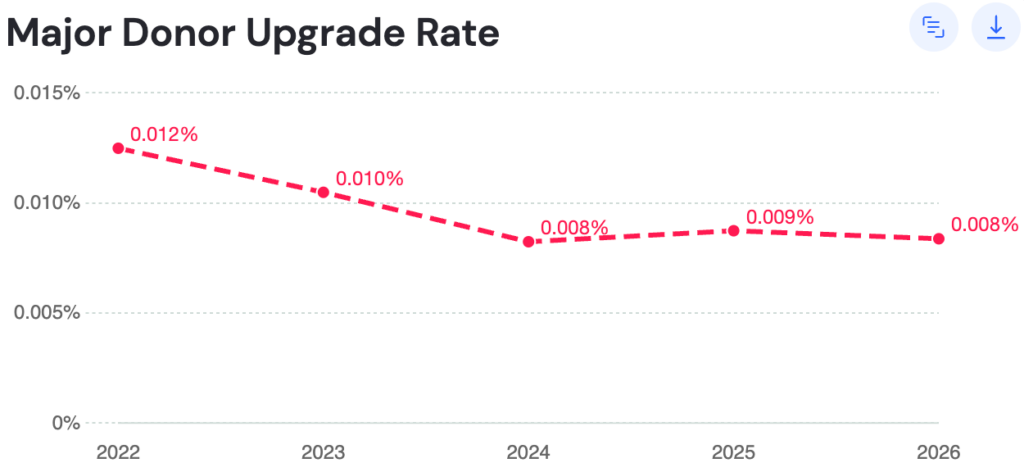
Major donor upgrade rates are 0.008%, an 11.1% decline from 12 months ago.
Giving Levels
- Broadbase donors: 97% of donors
- Midlevel donors: 2.7% of donors
- Major donors: .28% of donors
Avid’s Top 10 Nonprofit Fundraising Benchmark Trends
Below you’ll find 10 of the most interesting insights from the latest nonprofit fundraising benchmark trends.
Want to see a full breakdown of these insights? Check out the full webinar on The State of Fundraising in 2026 »
1. Revenue is growing—but fewer donors are giving.
Active donors declined 2.5%, while total revenue increased 3.9%. The result: nonprofits are raising slightly more money from a shrinking donor base.
2. Donors who remain are giving more.
Average revenue per donor increased to $362 from $350 12 months ago. Fewer donors are contributing, but those who stay are making larger gifts.
See how this breakdown changes based on organization size in the full Avid + Wiland benchmarks »
3. Mid-level and major donors are carrying more of the load.
Organizations are more reliant on mid-level and major donors than in previous years, with mid-level donors increasing to 2.7% of donors (from 2.2% in ‘22) and major donors rising to 0.28% (from 0.25% in ‘22).
4. Retention of high-value donors is declining.
Even as organizations depend more on larger gifts, retention is slipping:
- Mid-level retention fell to 66.9% (from 69.5% in ‘22)
- Major donor retention fell to 71.7% (from 75.3% in ‘22)
5. The pipeline for future major donors is weakening.
Upgrade rates into higher giving tiers are declining, suggesting fewer donors are progressing into mid-level and major giving—a potential risk for long-term fundraising growth.
- Major Upgrade Rate: fallen by 33% since ‘22
- Midlevel Upgrade Rate: fallen by 46% since ‘22
6. Donor acquisition is surging.
Nonprofits acquired 50.4% more new donors year-over-year, but not every vertical is seeing growth.
Out of the 8 key verticals in the Avid + Wiland benchmarks, half of them saw a decline in acquisition in the past 12 months. 2 verticals saw marginal acquisition growth, while 2 others are significantly skewing the average with massive spikes in donor acquisition.
7. New donors are increasingly coming from online channels.
Online acquisition sources jumped to 65.4% of new donors, up from 51% the previous year, signaling a major shift in donor behavior toward digital giving.
This shift is not just relevant to acquisition—it has implications for how fundraising teams approach onboarding, stewardship, cultivation, and more over time.
8. Reactivation is declining—especially offline.
While overall retention remains relatively stable (50.7%), reactivation rates are falling, particularly through traditional offline channels (4.6%, down from 7.9% in ‘22)
9. Multi-channel donors give more and upgrade more often.
Donors that are reachable across email, mail, and phone generate higher revenue per donor ($198) and are more likely to upgrade their giving. Contacts with email/postal/phone are 408% more likely to upgrade than postal only.
The ability to engage across multiple channels is becoming a key driver of growth.
10. Recurring donors are dramatically more valuable.
Recurring giving continues to rise, now reaching 23.1% of donors (up from 20.2% 12 months ago). These donors deliver significantly stronger results:
- Annual value: See these rates in the full benchmark »
- Retention: See these rates in the full benchmark »
- Upgrade rate: See these rates in the full benchmark »
You’re Missing the Most Important Insights!
The nonprofit fundraising benchmark snapshot above is looking at the overall trends. But the most important insights come from comparing to organizations like yours.
When you activate your free access to the Avid + Wiland fundraising benchmarks, you can see fundraising performance by vertical and by revenue size.
Use this to compare your performance to your peers—giving you more specific insights that you can turn into action.
Activate your free access to the Avid + Wiland fundraising benchmarks here »
Plus, you’ll find a deeper dive on key metrics related to:
- Recurring Giving
- Donor Lifecycle Trends
- Donor Contactability
- Multi-Channel Trends
- And more!